Lecture Notes
Preface
Read the preface. Prerequisites Linear algebra, some probability and statistics, and some experience in any programming language. Excellent list of supplemental reading given in pages (xix)-(xxi)
Code examples are available on github.
https://github.com/oreillymedia/doing_data_science
Chapter 1
We are witnessing the growth of well-defined feedback loops where our behaviors are driving products and vide versa. Technology makes possible large-scale data processig, increaed memory and bandwidth. Technology has become a integral part of the fabric of our daily life. Drew Conway's Data Science Venn diagram
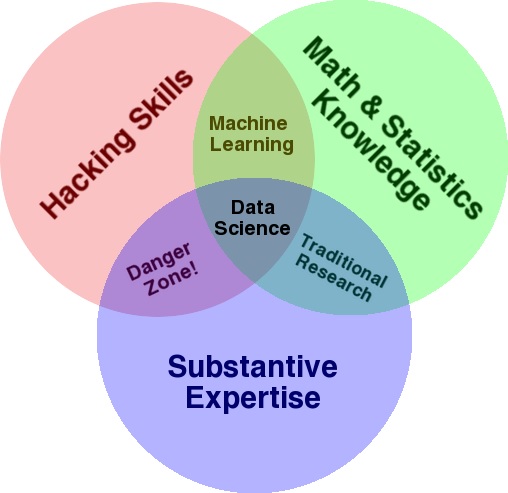
Data Scientist emerged as a job title only in 2012. Data Science is not just one subject like "Digital Systems". It is a combination of many skills and subjects.
Subjects: Computer Science, Math, Statistics and Machine Learning. Skills of communication and presentation skills, visualization, and coding. I dont expect any of you to be experts in all of these. This course will give you some exposure to all of these topics. From there you develop your interest in one or more of these and dig deeper into that topic.
In an industrial setup, a data science team is made up of people that contribute to these subject expertise and skills.
Notes from Chapter 2
This Chapter is about statistical inference, exploratory data analysis, and data science process. I will add to this Data-intensive Computing.
Lets understand the meaning of each of these topics.
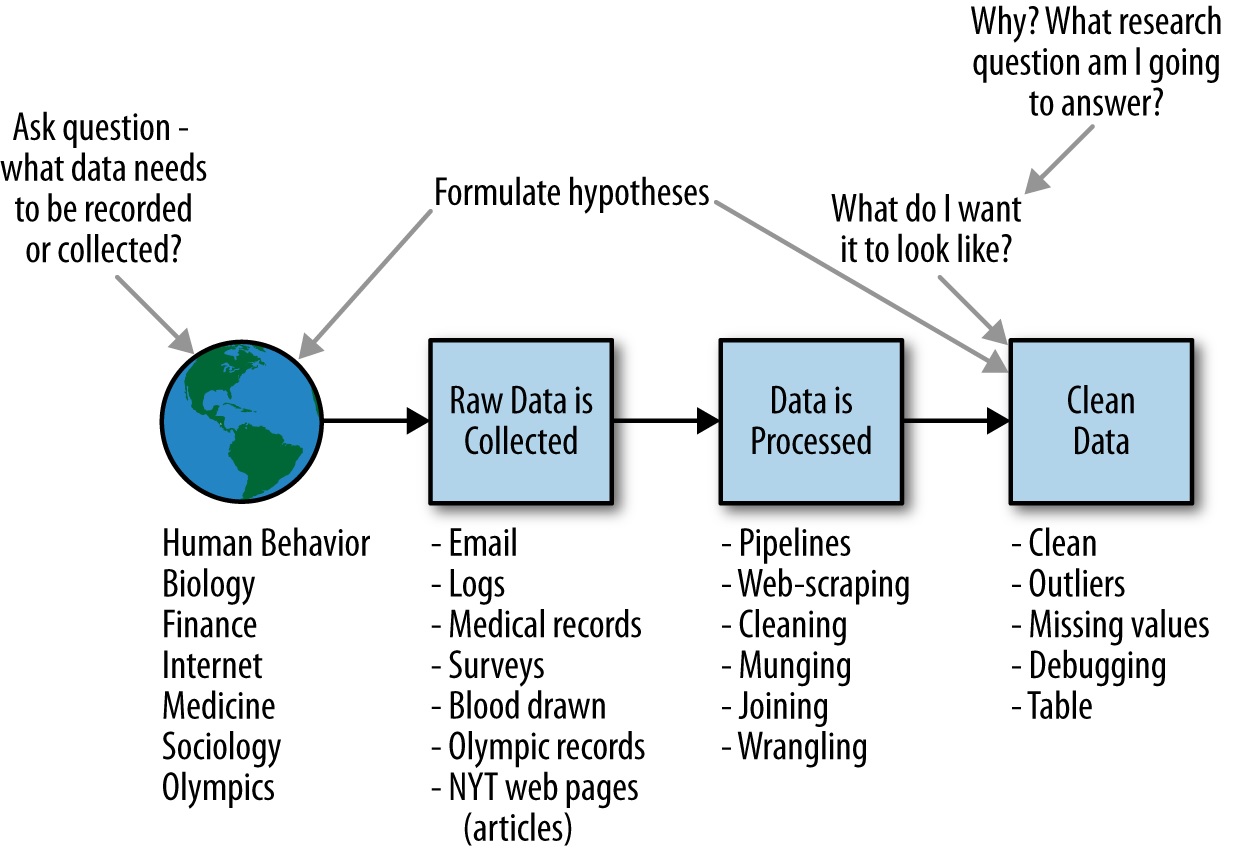
Data is an abstraction of the characteristics of real-world processes. The data we collect is often incomplete and has missing items; there is randomness and uncertainity associated with the data as well as in the process that collects the data. What is randomness? Outcome of a coin toss.
What is uncertainity? Something unknown about the data. How do you characterize it? Example: 20 cm ±1 cm, at a level of confidence of 95%
What is statistical inference? You collect data about real-world processes, analyze the data and arrive a underlying generative process. What to do with this knowledge? Apply it back to the real-world.
Populations and sample In statistical inference, population refers to all the possible data observations (N). Often we cannot collect every item. So we collect a sample size of n << N. You pick n observations to draw your conclusions. So the uncertainity.
There is uncertainity in the data as well as in the process that collects data. There is implicit bias (ex: yelp ratings). The uncertianity created by the sampling process is captured by the sampling distributions.
Traditiional data: numerical, categorical or binary
New Kinds of data: text (emails, tweets, news articles -- ch.4,7), logs (timestamped event, json files -- Ch.6,8), geo-locations (ch.2), network, sensor data and images. How do you process live streaming data? How can you sample from a linked structure without lossing critical nodes or information?
Big Data: Collecting all the data instead of a sample. Accepting messiness of data. Giving up on knowing the causes. N = all and even N=1 are the data sizes in big data realm.
Modeling is an attempt to understand and represent the world or object we are are trying to assess. It can be architectural, biological or mathematical, statitical, or DB. Finally we arrive at statistical modeling the main topic of this chapter. How do you build a model? if you have two column of data x and y, x being independent and y dependent. y = a+ bx is linear model or relationship. But how to you fit a model: Exploratory Data Analysis (EDA). EDA is done at the beginning of the data analysis cycle whereas visualization is done at the end of the analysis cycle.
 How do we do EDA? R Language (and RStudio) is a very nice tool for EDA. Lets explore RStudio.
My Notes from Chapter 2
We will continue our exploration of RStudio. More specifically, data acquisition phase of the EDA.
Statistical modeling represents an abstract view of the real world in terms of equations. Example is the linear we disuesses earlier. The questions to ask are: what is the underlying process? What comes first? What influences what? What causes what? What is the test of that?
How to build a model? Determining the functional form the data should take. EDA helps. Many processes generate data measurements whose empirical shape could be approximated by mathematical functions with a few parameters derived from the data. Example: mean, median, variance parameters of a sales data set. These functions are called the distribution functions and are the building blocks of statistical modeling.
Probability distribution functions are core and center of statistical models. And there infinite number of possible distributions.Here is
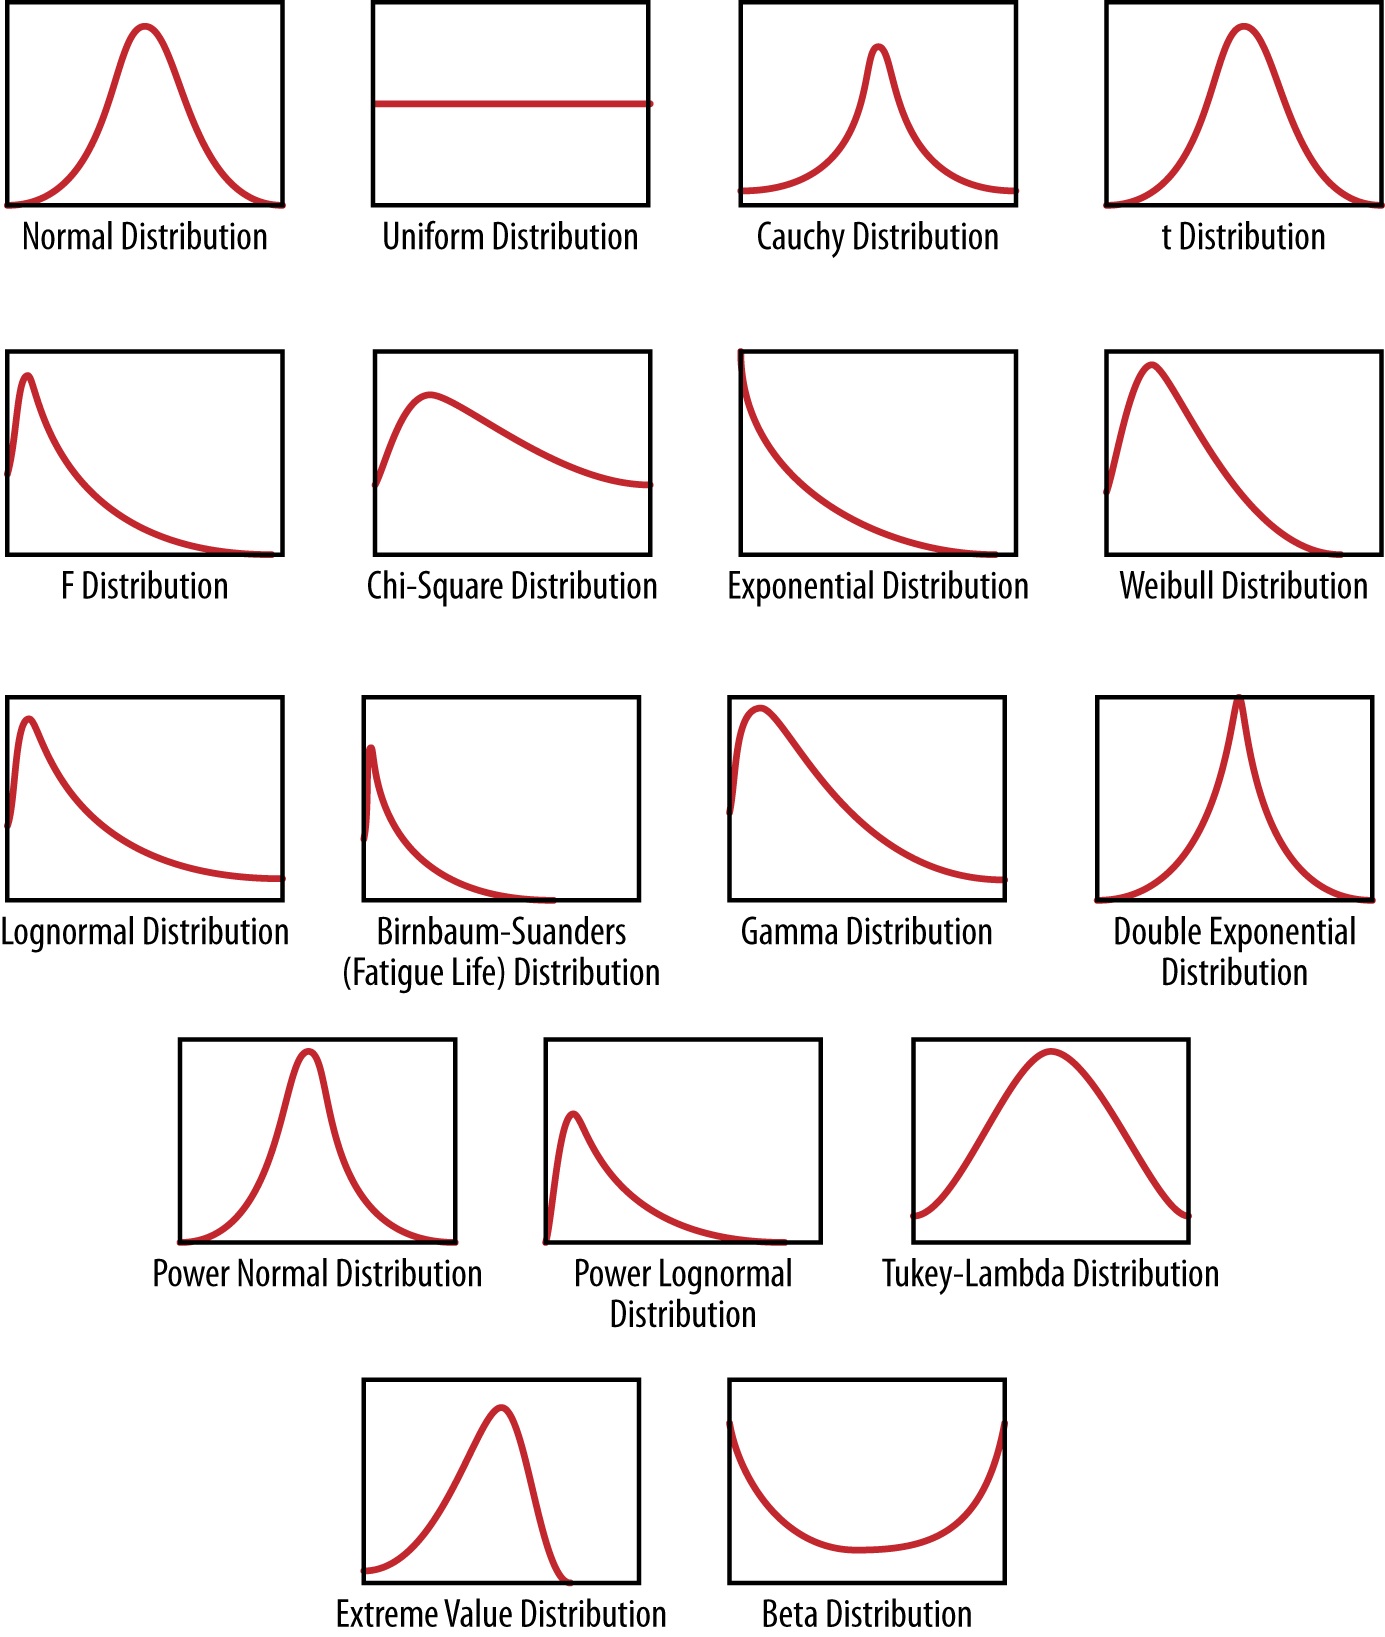 a set of distributions also known as probability density functions.
How do you interpret them?
A probability distribution is exactly what the phrase says: it assigns probability to a subset of possible outcomes, and has a corresposnding function associated with it.
Here it is for a very commonly used distribution, the normal distribution (Guassian):
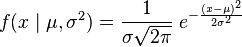
µ is the mean and median (same for normal distribution) controls where the distribution is centered, σ is the standard deviation( σ^2 is the variance)that determines the spread. These parameters will have to be estimated from the data.
More questions
- How is a probability density function different from any regular algebraic function?
- You have probabilty density function p(x) for a random variable x. How will determine the likelihood of a spcific value for x? Find the integral of the funcion for specific value range.
- How will you determine the right distribution for your data?
- What is you had multiple variables? Multivariate or joint distributions.p(x,y)
- Conditional distribution p(x|y) is the probabilty density function of x given y.
Fitting a model involves collecting data, and estimating the distribution and its parameters, and further applying optimization methods to fine tune the parameters.
References
1. Understanding Probability (3rd Edition) by Tijms, Henk -- ebook available in our library2. Principles of statistical inferenceby Cox, D. R. (David Roxbee) -- ebook available in our library
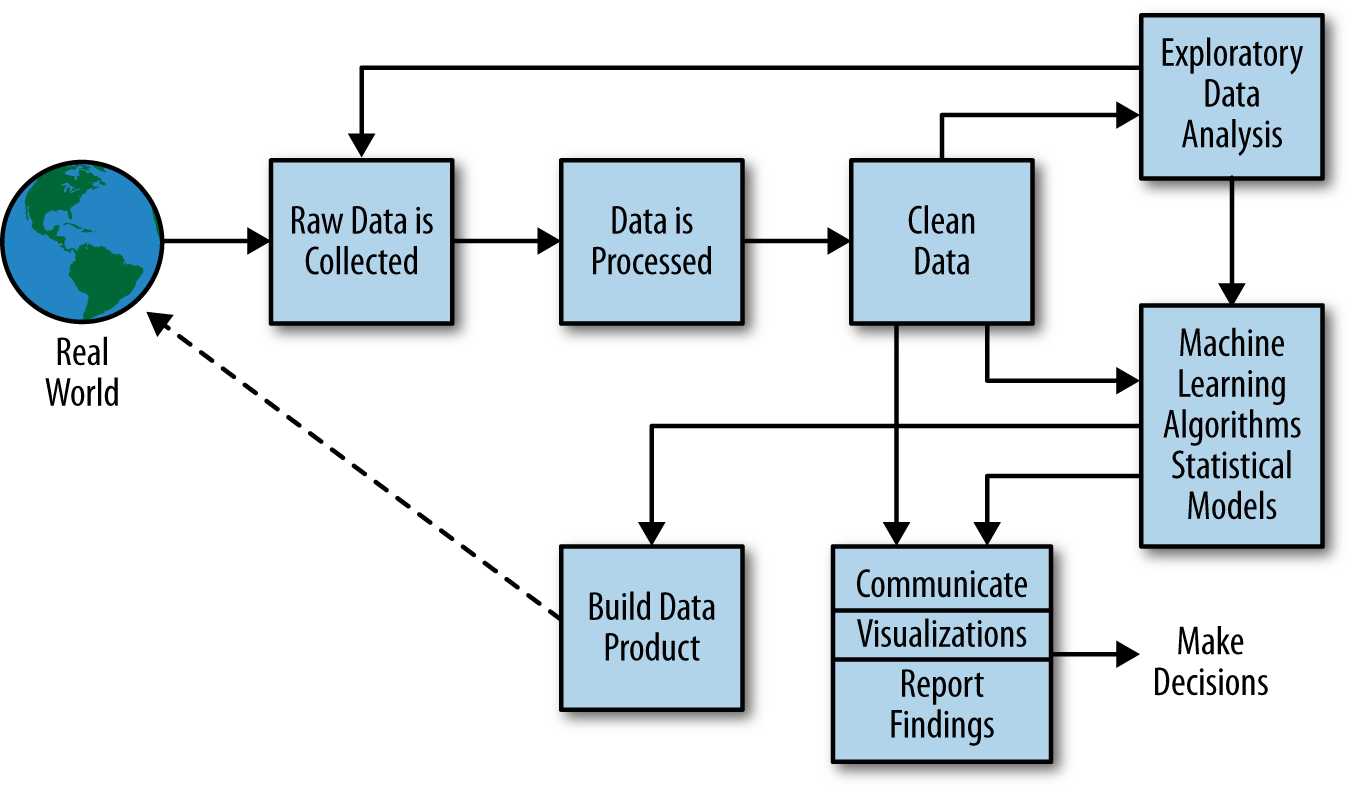
Data Science Process
We will discuss Project 1 that is expected to provide with good experience in EDA. We will breifly discuss a possible UI for R Environment.
Then we will discuss the data science process and the role of a data scientist.
EDA and R,RStudio
Last class we discussed the Project1 requirements. Today we will explore the EDA process for the the RealDirect problem discussed in Chapter 2. We will use a different data set than the one your text uses. We will use Manhattan's sales(rollingsales_manhattan.xls) instead of Brooklyn's sales. I will start from the very beginning: from raw data prpared for human consumption to arriving at some undecipherable plots and making sense out of these. Through this process we will learn some useful libraries, data cleaning methods (usefulness of regex), constructing new data out of existing data, and slice and splice data to make new data tables. And some useful plots for EDA: hist, plot, matrix of scatter plots. See the updated Project 1: edits highlighted.
Algorithms for Data Processing:: Chapter 3
Project 1: mutiple data sets are in nyt1..nyt31. See top of p.39 and also 37-38. We studied statistical modeling in the last few lectures. Today we will study algorithms for data analytics. Algorithm: steps or a procedure to do something. Algorithms are the basis of the design of elegant and efficient code, data preparation and processing and software engineering. Read p.52 difference between statistical modeling and algorithms. Machine learning algorithms discussed in this chapter are for classification, clusterng and predicting. Do not overfit. We will begin the discussion in the reverse order in which the text book does. K-means, K-NN, and linear regression.
EDA demo. Introduction Paralellism for Data Processing
We will explore more approaches to EDA: Specially we will look at using Linear Model (linear regression)
and K-means using R Studio. Here is the RHandout that we will demo.
We will show how to generate a report as we are EDAing. This will be useful for your Project 1 submission.
In EDA we develop several models as shown in p.86 of your text. Then choose the one that best explains your hypothesis.
We will introduce for the first time Parallelism for Data processing in Hadoop MR
Good reading material:The Unreasonable Effectivenss of Data. A. Halevy, P. Norwig. and F. Pereira. Google, IEEE 2009, Intelligent Systems 2009.
Top 10 Algorithms in Data Mining. X. Wu, V. Kumar et al, Knowl Inf Syst (2008) 14:1–37 DOI 10.1007/s10115-007-0114-2.
Introduction Paralellism for Data Processing HadoopMR Approach
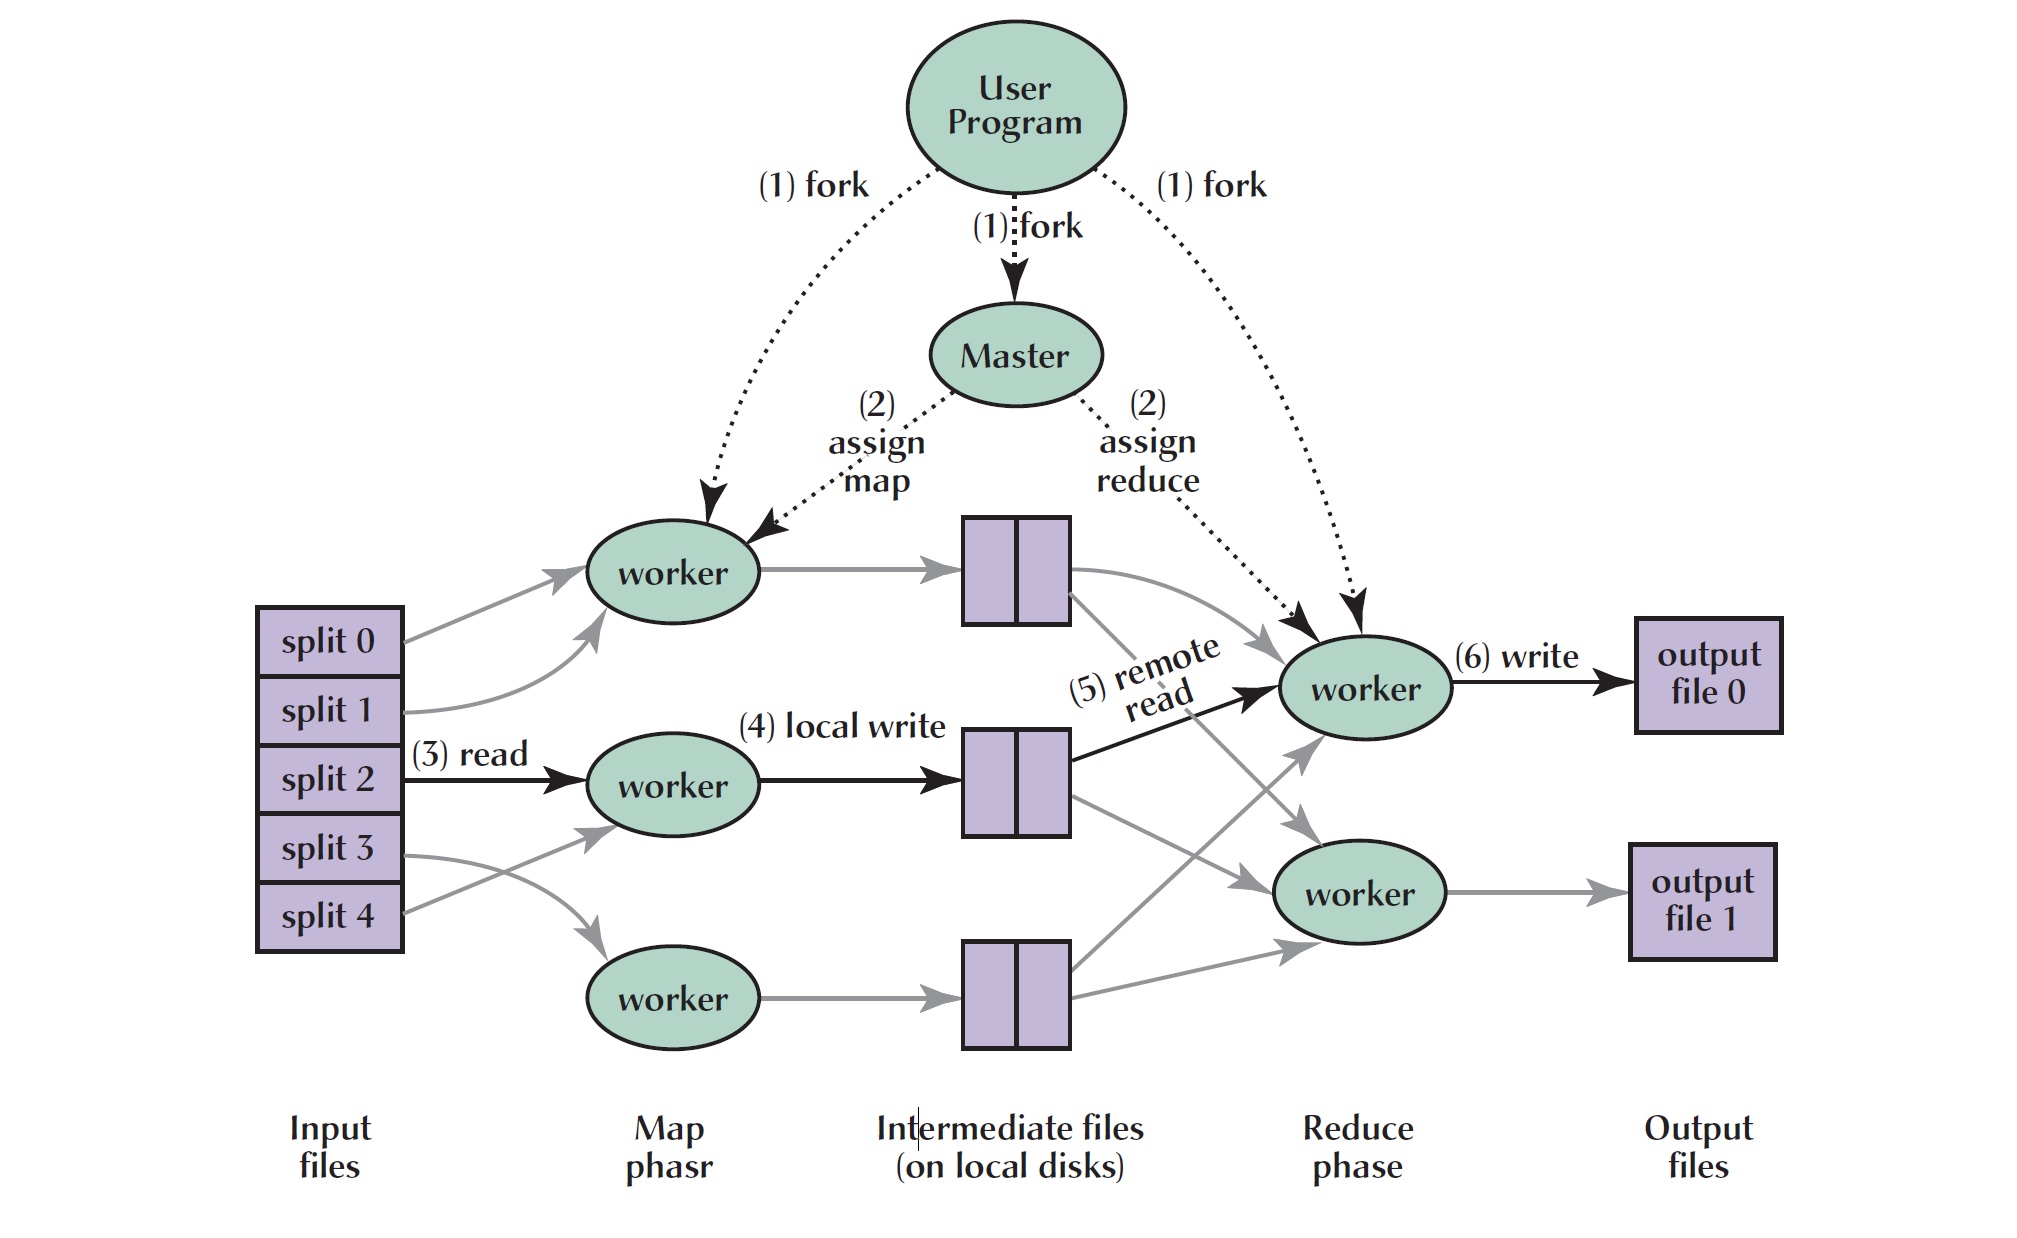
We will explore how this "big data" revolution came about by discussing large storage in Hadoop, a different kind of an algorithm to
process data in MapReduce, and treating unstructured data as "key, value" pairs.
Good reading material:
MapReduce: A Flexible Data Processing Tool By Jeffrey Dean, Sanjay Ghemawat Communications of the ACM, Vol. 53 No. 1, Pages 72-77, 2008.
The text book we will use as a guide guide for writing MR programs is as follows.
Data-Intensive Text Processing with MapReduce Jimmy Lin and Chris Dyer University of Maryland, College Park Manuscript prepared April 11, 2010.
 We will learn infrastructure details, MR programming (given a problem how to parallelize it), how to deploy and run a program for big data and also how storage and programming have evolved and are still evolving.
Amazon Elastic MapReduce
While EMR requires a cluster of at least 2 (Master and Data node), you will need a an account and security credential to work with any of the services offered by
by amazon. You can use CLI or interactive web interface to set up and configure individual machines and cluster.
We will begin with a launching a simple machine and then move onto a cluster later.
Amazon EMR documentation provides information about working with amazon EMR.Also look at one of the very early papers by Tom White (Hadoop Definitive Guide author) is a simple and clean intro to MR.
Notes from last class.