CSE4/587 Spring 2017
Data-intensive Computing = Data Science + Big Data Infrastructure
| Date | Topic | Chapter | Classnotes | To do: |
|---|---|---|---|---|
| 2/27 | Data Infrastructure | Introduction to MapReduce | C1 | Reading List |
| 3/1 | MR Theory and Programming; Hadoop | Introduction to Hadoop | C2 | Reading List |
| 3/6 | MR Theory and Programming: Chapter 2,3 | MR Basics | C3 | Reading List |
| 3/8 | MR Algorithm Design: Chapter 3 | MR Design | C4 | Reading List |
| 3/13 | MR Algorithm: Word-co-occurrence | Pairs and Stripes | C5 | Lab 3 |
| 3/15 | Exam 1 ... postponed | Snow day | Snow day | 3/18-3/26 Spring Break |
| 3/27 | MR Algorithm: Word-co-occurrence | Pairs and Stripes | C5 | Plan for Labs and Term Project |
| 3/27 | Hadoop VM and MR demo | MR wordcount | C6 | Lab 4 |
| 4/3 | Co-occurence using MR: Pairs and Stripes. Lab 4 discussion | Pairs and Stripes with Performance | C7 | Lab 4 |
| 4/5,10 | Inverted Index and Graph Processing | Chapter 4,5 | C8 | Shortest path; PageRank |
| 4/12 | Pagerank; Term Project; Tableau | Chapter 5 | C9 | PageRank |
| 4/17 | Term Project: Tableau; Apache Spark | Classnotes | C10 | Introduction to Spark |
| 4/24 | Motivating Apache Spark: Pig, Hive and what else? | Classnotes | C11 | Introduction to Pig |
| 4/26 | Programming in Pig: Declarative syntax | Classnotes | C11 | Alan Bates' Pig Programming Ch.1-5 |
| 5/1 | Word Co-occurrence in Spark | Classnotes | C12 | Apache Spark |
| 5/3 | Logistic Regression | Chapter 5 | C13 | Logictic Regression |
| 5/8 | Final Exam Review | Finals: 5/15: 7-10PM 225 NSC | C14 |
Data Infrastructure
Introduction
In the 1990's during the early days of the Internet, the access mode for home computing was through a humongous modem that made this characteristic noise. People had one of the two or three service providers: Prodigy, or Compuserve and probably the web and the search was the only application. Even that was slow. The "web page" was not fancy since most people had only line-based terminals for accessing the Internet. One of the popular browsers was called "Mosaic". When you query for the something it took such a long time that you can clean up your room by the time the query-results arrived.
In late 1990's Larry Page and Sergei Brin (Standford graduate) students worked on the idea considering the web as a large graph and ranking the nodes of this connected web. This became the core idea for their thesis and the company they founded, Google. Google that has since become the byword for "search". The core idea is an algorithm called "Pagerank". This is well explained in a paper [1] written about this thesis.
Until Google came about the focus was on improving the algorithms and the data infrastructure was secondary. There were questions about the storage use for supporting this mammoth network of pages and their content that are being searched. In 2004 two engineers from Google presented an overview paper [2] of the Google File System (GFS) and a novel parallel processing algorithm "MapReduce". A newer version of the paper is available at [3] .
Of course, Google did not release the code as open source. Doug Cutting an independent programmer who was living in Washington State reverse engineered the GFS and named it after the yellow toy elephant that belonged to his daughter. Yahoo hired him and made Hadoop open source.
In 2008 Yahoo, National Science Foundation and Computing Community Consortium gathered together educators, industries, and other important stakeholders for the inaugural Hadoop Summit. Look at the list of attendees here I learned Hadoop from Doug Cutting. It is imperative that we study Hadoop and MapReduce together to learn their collective contribution.
Let us understand the foundation of the Big Data Infrastructure that has become integral part of most computing environments. We will approach this study by processing unstructured data as discussed in text [4] .
Plan for today
- Lab 2 Questions: it is due 3/11
- Large Scale Parallel Processing of Text Data
References
- K. Bryan and T. Leise. The $25,000,000,000 Linear Algebra Behind Google. here.
- Dean, J. and Ghemawat, S. 2004. MapReduce: Simplified data processing on large clusters. In Proceedings of Operating Systems Design and Implementation (OSDI). San Francisco, CA. 137-150. MR, last viewed 2017.
- Newer version in ACM of the above paper here.
- J. Lin and C. Dyer. Data-Intensive Text Processing with MapReduce, Synthesis Lectures on Human Language Technologies, 2010, Vol. 3, No. 1, Pages 1-177, (doi: 10.2200/S00274ED1V01Y201006HLT007). Morgan & Claypool Publishers. An online version of this text is also available through UB Libraries since UB subscribes to Morgan and Claypool Publishers. Online version available here
Hadoop
Introduction
I have decided to introduce the Hadoop infrastructure before we move onto solving problems using MR and appreciate the beauty of MR.
Plan for today:
- Lab 2 questions: For the Pew data, create questions that need categorization, using functions similar to RealDirect Manhattan example, grouping, use of such built-in functions as as.numeric, na.omit; for visualization qplot, geom_histograms, simple distributions, simple scatter plots, box plots showing mean, median and quartiles; For example, how was participation among the age categories in the dating applications? (Ans: qplot similar to titanic, M/F as x-axis, AgeCat as Y-axis, and orange dot as No, and green dot as Yes).
- We will look at fundamental features that make Hadoop different from other file systems, and study the evolution from Hadoop1.x to Hadoop 2.x.
- Hadoop 1.X: The Distrbuted File System for Big Data
- Hadoop 2.x: The Distributed OS Supporting Big Data Application
- We will also start studying the MR model from Lin and Dyer text. Read chapter 1 and Chapter 2.
MapReduce Basics
Chapter 2
Last class we studied a very high level structure of Hadoop. Today we will begin a series of exploration through MR programming.
Plan for today:
- Lab 2 questions: For the Pew data, create questions that need categorization, using functions similar to RealDirect Manhattan example, grouping, use of such built-in functions as as.numeric, na.omit; for visualization qplot, geom_histograms, simple distributions, simple scatter plots, box plots showing mean, median and quartiles; For example, how was participation among the age categories in the dating applications? (Ans: qplot similar to titanic, M/F as x-axis, AgeCat as Y-axis, and orange dot as No, and green dot as Yes).
MR basics as discussed in Chapter 2 of Lin and Dyer. We will analyze the figures 2.2, 2.3 and 2.4 and update/correct them and also write our own code.
- Here is an overview
Chapter 3
In chapter 2, we studied the naive (basic) approach to MR. In chapter 3, we will study improvements to the basic design (i) in-memory combiner using associative arrays (ii) complex "values" for word co-occurrence problem in the form of pairs and stripes and most importantly their performance evaluation.
Mapreduce Algorithm Design
- "simplicity" is the theme.
- Fast "simple operation" on a large set of data
- Most web-mobile-internet application data yield to embarrassingly parallel processing
- General Idea; you write the Mapper and Reducer (Combiner and Partitioner); the execution framework takes care of the rest.
- Of course, you configure...the splits, the # of reducers, input path, output path,.. etc.
- Programmer has NO control over
-- where a mapper or reducer runs (which node in the cluster)
-- when a mapper or reducer begins or finishes
--which input key-value pairs are processed by a specific mapper
--what intermediate key-value pair is processed by a specific reducer - However what control does a programmer have?
- Ability to construct complex structures as keys and values to store and communicate partial results
- The ability to execute user-specified code at the beginning of a map or a reduce task; and termination code at the end;
- Ability to preserve state in both mappers and reducers across multiple input /intermediate values: counters
- Ability to control sort order, order of distribution to reducers
- ability to partition the key space to reducers
MapReduce Design
Introduction
Mapreduce design includes these steps:- Examining the problem statement for opportunites for data parallelism
- Stage the data on a distributed file system
- Write the Mapper and map method that breaks (cleans, filters, maps) the data into pieces of "
- Write the Reducer and reduce method that coalesces the "key value" pairs into "key value" set that solves the problem
Hadoop MR Data Pipelines
There are many environments you could work on for MR. We will use VM created by Luigi and the one that is available on UBox.The instruction for a simple MR program with sample data is available here.
Exam Review
Topics:(i) Chapters 2 and 3 from Doing data science book: Evalaution metrics
(ii) Hadoop infrastructure (lecture notes)
(iii) MapReduce program design: Chapter 2
(iv) R language basics: Data frame?
Lab 2 Pew Data Analysis
- You need at least 5 questions or problem solved for Pew Data.
- These cannot be simplistic like a pie chart of one column data
- You should include at least 2 columns
- You should apply "group by" and such dplyr operations
- The questions answered should meaningful, useful.
- For plotting the data data they use ggplot, qplot, geom-histogram etc.
- Use titanic, dplyr (sqllite) vignettes as examples.
- You have to use functions as in Brooklyn example in Ch.2 of text book
MapReduce Design
Hadoop MR Data Pipelines
There are many environments you could work on for MR. We will use VM created by Luigi and the one that is available on UBox.The instruction for a simple MR program with sample data is available here.
Exam Review
Topics:(i) Chapters 2 and 3 from Doing data science book: Evaluation metrics: 10,15,15 points for the three algorithms
(ii) MR infrastructure : 20 points
(iii) MapReduce program design: Chapter 2: Lin and Dyer: major question: 20 points
(iv) R language basics: Data frame? Construct, manipulate, functions with dataframes: 20 points
Lab 3 Application of algorithms
Lets discuss Lab3. It is about application of the algorithms discussed in Chapter 3. If we had gone by the regular lab schedule we would have wored on the material before the exam.MR Algorithm Design (Contd.)
Lets discuss Figure 3.6 and 3.7. The former will help with the exam question. The later illustrates attempts at optimizing within the Mapper with pre- and post-rocessing and in-memory aggregation.MapReduce Design
Hadoop MR Data Pipelines
There are many environments you could work on for MR. We will use VM created by Luigi and the one that is available on UBox.The instruction for a simple MR program with sample data is available here.
Yahoo Tutorial on MR wordcount
This is like the Hello World of MR on HDFS. Lets understand the demo first and then walkthrough the tutorial. Here are some important points to note about the demo:- The demo is run on a VM that has two file systems, one its own local system and another the HDFS.
- You move data into HDFS before you run MR.
- After MR completes you move output data to your file system to view it.
- The executable itself (wordcount and other excutables) is provided in "exdcutable" jar file.
Processing Large Graphs
Lab 4: More details
- For MR: You can use Docker images instead of VM provided.
- The processing is somewhat like inverted index.
- Use the lemmetizer within the zip file (not the one outside) in the UBBox.
- Where do you normalize? in the mapper? Where do you lemmetize? Where is lemmetizer stored?
- Word co-occurrence is the analysis the stakeholder want. Where did a bi-gram (or n-gram) occur in document1, document2 etc.? "
- There does not seem to be an interest in "count" itself!
for each word in the text
normalize the word spelling by replacing j with i and v with u throughout
check lemmatizer for the normalized spelling of the word
if the word appears in the lemmatizer
obtain the list of lemmas for this word
for each lemma, create a key/value pair from the lemma and the location where the word was found
else
create a key/value pair from the normalized spelling and the location where the word was found
Term Project
Bad news: no data available from City of Buffalo (at least not immediately for us to use).Please discuss any ideas with me by email. I will release a formal statement soon.
Tableau Licenses are available for all. I will do a full demo Monday.
Graph Algorithms
This is from Ch.4 and 5 of Lyn and Dyer. Ch.4 is on MR inverted index and Ch.5 is on graph algorithms.- Web search problem has three major components: web crawling, inverted index development and information retrieval.
- Web crawling and inverted index are done offline to facilitate a fast realtime response for IR. We will begin with an example. Then we will look at MR algs for inverted indexing. We will begin with a baseline implementation, and then a revised one
- Graph algorithms: We will discuss graph problems, graph representations
- We will discuss Dijkstra's algorithm and then MR alg for paralell breadth first search for large graphs
- We will move onto pagerank algorithm as specified in Ch.5
Pagerank
Lab 4: More details
Activity 4a. Output in the form shown here.Term Project
Term project is about "Building a Data Product and Communicating Data". See the description herePage Rank Discussion
Linear algebraic formulation of the problem was discussed last class. See the notes here.we will discuss a numerical example (walkthru') of the pagerank computation.
Data Visualization using Tableau
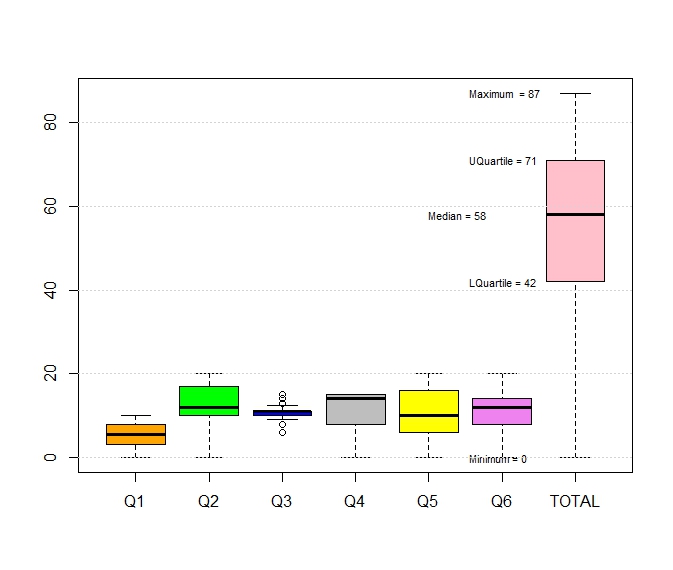
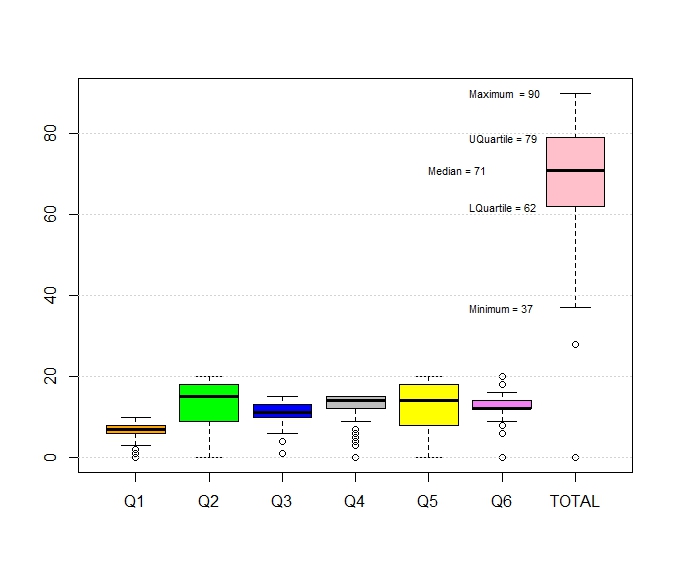
Tableau is a proprietary software to perform data analysis. It provides drag and drop tools to create data visualization that does not require programming. We will briefly examine the features of tableau here.Grade Analysis
I did not remove nulls (0s).Undergraduates
Graduates
Apache Spark
Data Visualization using Tableau
Tableau is a proprietary software to perform data analysis. It provides drag and drop tools to create data visualization that does not require programming. We will briefly examine the features of tableau here.Tableau demo
See UbBox for all term project data including Tableau license.Apache Spark
Apache Spark addresses many of the issues with Hadoop MR. We will start with an overview of Spark and then move into a simple demo and Lab5. Apache SparkMotivating Apache Spark: Pig And Hive
Topics for Today
- Retrospective on Lab4: Takeaways
- We will discuss briefly Lab5, the last one: you can work in groups of upto 2. Here is Lab5: Big Data Processing with Apache Spark.
- Lets study Apache Pig data flow language and Apache Hive (later)(created by Facebook) as a means of understanding the motivation for Spark. Pig, Hive to Spark
Pig Programming
Topics for Today
- Download pig on Timberlake and try all the examples
- Today's discussion is based on Alan Bates's Pig book. Check the e-book in UB Libraraies.
- We will focus and understand the material as a basis for Spark Programmign later on.
- Decalarative vs imperative languages: You define (/program) what you want and let the infrastructure optimize, paralellize and execute, cleanup and produce results. Deep learning frameworks use this approach: tensorflow.
Co-Occrrence Spark way
Topics for Today
- Install spark shell according to Apache Spark guide or as per this link.
- Learn basic Spark commands and buult-in functions
- We will demo a simple MR with sample data (cat sat tin roof) and then with Latin text.
- Next we will transcend back Doing Data Science text Ch.4 and Ch.5. Ch.4 is about Bayesian classification and Ch.5 is about Logistic Regression.
Logistic Regression
Topics for Today
- Lets finish Bayesian example worked out in the text: Spam Vs Ham
- Logistic Regression: Chapter 5: Logistic Regression
- Some observations about Term Project
- Lets see if we can repeat demo on Spark
Hadoop

Hadoop 1.x
Hadoop 2.x: YARN