|
- Image segmentation, labeling and computer aided diagnosis
:
Our project, computer aided diagnosis system for lumbar area, LumbarCAD, aims at
automating the various routine diagnosis steps within the work flow of the
clinical neuroradiologist as shown in Fig. below. Diagnosis automation utilizes
the neuroradiologist time and makes decision making faster and more efficient.
Our work toward a clinical computer aided diagnosis system for lower spine area
(LumbarCAD) has achieved several milestones as follows.
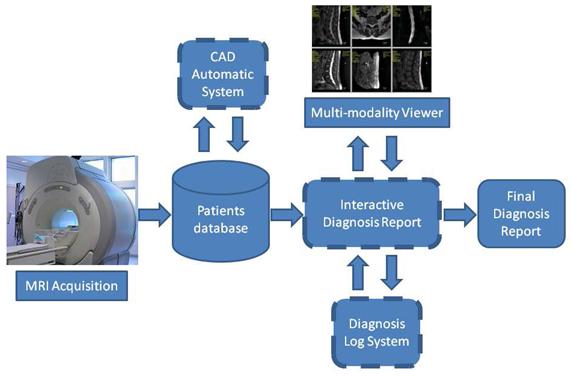
Clinical work flow of lumbar diagnosis - LumbarCAD main
components are illustrated in dashed boxes
|
- Anatomic structures localization, labeling, and segmentation :
Our methods are based on jointly modeling of appearance, shape and, context information to localize, label,
and segment the anatomical structures in the lumbar area. This step is necessary for all further automated
diagnosis tasks. Its robustness is of great importance.
|
We developed a two level generative probabilistic model that incorporates low- (pixel-)
level information such as disc appearance and high- (object-) level information such as location and context.
We do full and direct inference using expectation-maximization for localization of the discs of interest.
We validated our model on 105 cases that include normal and abnormal cases and obtained over 91% detection and
localization accuracy.
We proposed a method to accurately associate an axial MRI with the particular intervertebral disc
in a pre-labeled sagittal lumbar region MRI. A statistical distance prior from multi-protocol MR images of 68
patients is used in labeling process to accommodate the variability of the distance among patients of different
ages and gender. Experiments with 93 patient data including 465 lumbar discs show that our method can assign the
class membership to scan lines with over 92% accuracy.
We also proposed an automatic segmentation method that extracts the spinal cord and the Dural Sac from
T2-weighted sagittal magnetic resonance (MR) images of lumbar spine without the need of any human intervention.
In one method the segmentation is based on a novel saliency-driven attention model and a standard active contour model
that requires no human intervention or training. Experiments based on 60 patients’ data show that this procedure performs
segmentation robustly, achieving a similarity index of 0.71 between the segmentation by our model and reference segmentation,
as compared to a similarity index of 0.90 between two observers. In another method the segmentation utilizes a gradient vector flow (GVF)
field to find the candidate blobs and performs a connected component analysis for the final segmentation. MR Images from
52 subjects were employed for our experiments and the segmentation results were quantitatively compared against
reference segmentation by two medical specialists in terms of a mutual overlap metric. The experimental results showed that,
on average, our method achieved a similarity index of 0.7 with a standard deviation of 0.0571 that indicated a
substantial agreement.
|
|
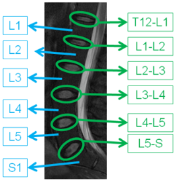
Labeling of Discs
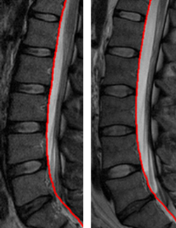
Delineation of Dural Sac
|
|
- Automated Diagnosis : Our research in the diagnosis has also shown great progress.
We summarize our work on the many diagnosis tasks.
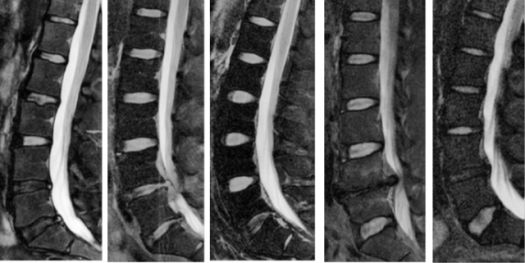
Various disc abnormalities evident from MRI
|
- General pathology detection :
This work integrates various intensity, shape,
and context features of abnormal discs to detect abnormal discs regardless of the abnormality type.
This step is a preprocessing step for all subsequent diagnosis tasks that aims at reduction of processing
time by concentrating only on abnormal discs. We achieved over 91% abnormality detection accuracy on 80
abnormal clinical cases.
- Diagnosis of disc desiccation :
Disc desiccation is caused by drying out of the water content of the disc (normal discs contain 85% water).
Disc desiccation is a widely popular problem and almost every person will have it by a certain age. We developed
a Bayesian framework that integrates both a disc intensity model and an inter-disc intensity context model to
robustly detect desiccated discs. We achieved over 96% desiccation detection accuracy on 55 clinical cases with
desiccation on at least one disc.
- Diagnosis of disc herniation :
Disc herniation is one of the most popular disc problems that cause lower back pain.
Disc herniation has various levels starting from small buldging
up to the free segment where a portion of the disc will separate from the disc itself causing
severe mobility and pain problems.
We developed a Bayesian model that integrates both intensity and shape features.
We used an empirically-motivated Gaussian model for extraction of intensity-based features.
We also utilized an active shape model to segment the disc and then extract a set of shape features.
Our Bayesian model then integrates all the features for detection of herniated discs. We achieved preliminary
results of over 90% herniation detection accuracy on 33 cases. We enhanced our model by utilizing
a GVF-Snake Model for better segmenting the discs and the herniated portion of the disc. We achieved better
performance on greater dataset. Herniation detection accuracy was over 92.5% on 65 clinical cases.
Furthermore, we performed a comparative study on several classifiers for disc herniation diagnosis based
on lumbar MR images. Our method of herniation detection consists of two stages: the preprocessing stage
and the classification stage. In the preprocessing stage, regions of interest (ROIs) are cropped and
class labels are assigned to disc, vertebra and spinal cord regions based on manually marked boundary points.
Then the feature vector is generated by computing the percentage of each label within each sub-window.
In the classification stage, three classifiers, a perceptron classifier, a least-mean-square classifier
a support vector machine classifier, are used for training and testing. The classification results are
evaluated by comparing the diagnostic decisions from the classifiers against those of radiologists.
Experimental results on a limited data set of 68 clinical cases with 340 lumbar discs show that
our classifiers can diagnose disc herniation with 97% accuracy. We proposed a disc herniation diagnosis
method based on computer-aided framework for the management of lumbar spine pathology in MRI.
The experiments with 70 subjects based on the proposed framework successfully detected disc herniation
with 99% diagnostic accuracy, achieving a speed up factor of 30 in comparison to radiologist’s diagnosis.
The on-going study demonstrates that this framework can be applied to the diagnosis of various abnormalities
in the lumbar spine. The novel CAD framework for diagnosing lumbar spine pathology consists of 11 components
: target pathology selection, meta data analysis, inter- and intra-slice analysis,
preprocessing, regions of interest determination, localization/labeling of landmark regions,
ROI quantification, feature generation, classification, reference generation, and validation.
- Diagnosis of spinal stenosis : we proposed a method to diagnose
lumbar spinal stenosis (LSS),
a narrowing of the spinal canal, from magnetic resonance myelography (MRM) images. Our method segments the thecal sac in the
preprocessing stage, generates the features based on inter- and intra-context information, and diagnoses lumbar disc stenosis.
Experiments with 55 subjects show that our method achieves 91.3% diagnostic accuracy.
- Implementation on CUDA : We have developed GPU algorithms on the GPGPU
platform using CUDA
to evaluate dose computations using Monte Carlo techniques for use in radiation therapy [19] We also implemented
cross-correlation, image gradient calculation, Sobel filtering, Gaussian convolution and matrix multiplication in
CUDA using both texture memory and shared memory. CUDA streaming and cublas libraries have also been used for computational
ease and better speedup. These code segments can be used for various image pre-processing and medical imaging applications
to achieve speedup in computationally intensive jobs like image registration. Deformable registration using B-splines,
not only employ state of the art techniques, they are also time-consuming and hence for intra-operative image registration,
GPU programming is the next step. We have also identified potentially important areas in medical imaging where GPUs can be
used like analyzing and registering fMRI and DTI images.
- Computed tomography – linear and non-linear hierarchical/scalable approaches
Over the past two years, we have pursued efforts in computed tomography (CT)
and blood flow analysis which are related to the II-NEW: Acquisition of BCI - A Biomedical Computing Infrastructure.
GPU-based cone beam computed tomography
The use of cone beam computed tomography (CBCT) is growing in the clinical arena due to its
ability to provide 3D information during interventions, its high diagnostic quality (submillimeter resolution), and
its short scanning times (60 s). In many situations, the short scanning time of CBCT is followed by a time-consuming
3D reconstruction. The standard reconstruction algorithm for CBCT data is the filtered backprojection, which for
a volume of size 2563 takes up to 25 min on a standard system. Recent developments in the area of Graphic Processing Units (GPUs)
make it possible to have access to high-performance computing solutions at a low cost, allowing their use in many
scientific problems. We have implemented an algorithm for 3D reconstruction of CBCT data using the Compute Unified Device Architecture (CUDA)
provided by NVIDIA (NVIDIA Corporation, Santa Clara, California), which was executed on a NVIDIA GeForce GTX 280.
Our implementation results in improved reconstruction times from minutes, and perhaps hours, to a matter of seconds,
while also giving the clinician the ability to view 3D volumetric data at higher resolutions.
We evaluated our implementation on ten clinical data sets and one phantom data set to observe if differences occur between CPU
and GPU-based reconstructions. By using our approach, the computation time for 2563 is reduced from 25 min on the CPU to 3.2 s on the GPU.
The GPU reconstruction time for 5123 volumes is 8.5 s.
By introducing GPU-based approaches to improve CT reconstruction times, we have been able
to investigate GPU implementations of direct inverse and iterative techniques for CT reconstruction. For the direct inverse
case, we have implemented a new reconstruction approach called GOAT (Geometric Object Aware Tomography) which achieves accurate
reconstructions from just tens of projection images (rather than the typical hundreds or thousands). Our approach reconstructs
the 3D volume by first identifying objects-of-interest (OoIs) and their complements (C-OoIs), and then separating them in the
projection space using geometry techniques so that only directly related projection rays are used to reconstruct each OoI.
Comparing to existing approaches, our approach simultaneously and significantly improves patient dose (through reducing the
number of projections), image quality, and computation time. For the iterative techniques, we have implemented forward projection
algorithms on the GPU allowing us to improve significantly (factors of hundreds) the speeds of arithmetic reconstruction techniques (ART).
In addition, the turn-around time for GPU-based CT reconstruction has allowed us to pursue
other acquisition methodologies, specifically filtered-region of interest CT, in which an x-ray attenuating filter with an
aperture is placed in the x-ray beam to reduce the dose in the regions of low interest, while supplying high image quality
in the region of interest (ROI).The central region is imaged with high contrast, while peripheral regions are subjected to
a substantial lower intensity and dose through beam filtering. The resulting images contain a high contrast/intensity ROI,
as well as a low contrast/intensity peripheral region, and a transition region in between. To equalize the two regions’
intensities, the first projection of the acquisition is performed with and without the filter in place. The equalization
relationship, based on Beer’s law, is established through linear regression using corresponding filtered and nonfiltered data.
The transition region is equalized based on radial profiles. Evaluations in 2D and 3D show no visible difference between
conventional FROI-CBRA projection images and reconstructions in the ROI. CNR evaluations show similar image quality in the ROI,
with a reduced CNR in the reconstructed peripheral region. In all filtered projection images, the scatter fraction inside the ROI
was reduced. Theoretical and experimental dose evaluations show a considerable dose reduction; using a ROI half the original FOV
reduces the dose by 60% for the filter thickness of 1.29 mm. These results indicate the potential of FROI-CBRA to reduce the dose
to the patient while supplying the physician with the desired image detail inside the ROI.
Characterization of blood flow
Three-dimensional (3D) imaging of the vasculature is readily available for patients from
rotational angiography, biplane imaging, computed tomography angiography (CTA), magnetic resonance angiography (MRA), and
ultrasound. Because of the ubiquity of the 3D vascular data, a number of groups are developing patient-specific methods
for calculating the flow field and flow parameters associated with vascular abnormalities, usually using computational fluid
dynamics (CFD). For many patients, the 3D data may be available a week or more in advance of the treatment, so CFD could be
used to ask and answer some questions regarding the patient. However, for most patients especially those in emergency situations,
CFD is not an option, because the time lines are just too short. The clinician requires answers usually within minutes.
To achieve substantial speed improvements while maintaining accuracy, we intend to take advantage of a priori knowledge of the
spectrum of situations that may arise and generate a library of solutions to these situations, which is then statistically
parameterized to allow rapid identification of solved situations which are similar to the problem at hand. Once identified,
the variances between the solved situation and problem at hand are then determined and used to spawn initial conditions to
jump-start the solution of the CFD differential equations, obviating the evolution to solution from a null starting point.
In addition, we will make use of multi-resolution approaches in the subsequent solution of the differential equations,
guided by the a priori knowledge and statistical understanding of the critical parameters to modulate the path to solution
to maintain speed and optimize the accuracy of the solution.
|
We have developed 2D and 3D CFD code which has been ported to GPU implementation.
From the 2D and 3D investigations we have found that the changes in the flow patterns with changing parameters, such
as percent stenosis, length of stenosis, viscosity, and velocity, appear to follow relatively simple relationships, i.e.,
differential changes in the parameters result in differential changes in the flow patterns.
The image on the right illustrates the CFD results for various percent
stenosis and stenosis length. The percent stenosis varies within an image and
the length of the stenosis varies between the images. We see that the flow velocity in the stenotic region and
the extent of the post-stenosis jet increase with increasing percent stenosis. But the progression of these effects
is relatively “simple” and, we hypothesize, could be represented in functional form. We also see that the flow patterns
change little with change in length of stenosis.
We are in the process of expanding our database of results generated with
the various parameters, as the start of our database library.
|
|
As a start of using this library approach, we have developed a new method for rapidly
determining the velocity and pressure fields for arbitrary vessel geometries. Using the database of precomputed CFD solutions
(3D velocity and pressure fields) for various 3D vessel geometries and initial conditions, we map all vessel data into a
single “common” vessel geometry through a homeomorphic mapping which facilitates interpolations across the various vessel geometries.
Initial investigations (above) showed that the velocity and pressure fields appear to vary smoothly with changes vessel geometries and
initial conditions, indicating that CFD solutions for a given vessel geometry and initial conditions can be interpolated from CFD
solutions having similar vessel geometries and initial conditions. Thus, we have developed and evaluated approaches to generate CFD
solutions for new patient geometries from those in our database. Using a Pentium 4 3.2 Ghz, we query the database and generate by
interpolation velocity and pressure fields for arbitrary (but similar to those in our database) vessel geometries and initial conditions
in less than a minute, with the accuracy depending on the density of the CFD solution space. Defining accuracy as the percent agreement
between the estimated and the known, we have found that the accuracy of our interpolated velocities is as high as 99% for geometries near
the patient geometry and as low as 95% for geometries distant from the patient geometry. For pressure, our accuracy is as high as 99.7%
for geometries near the patient geometry and as low as 99% for geometries distant from the patient geometry.
The only caveat lies in the fact of a mathematical bifurcation that occurs in extreme diseased vessels where a recirculation zone generates.
Interpolating across this bifurcation point can yield poor accuracy. This prototype system rapidly and accurately produces velocity
and pressure fields for arbitrary vessel geometries. This system may be useful for other applications in which databases of solutions
are available.
|
The image above shows the 3D reconstructed Volumes. Light pink is the actual distribution,
Green is the calculated distribution. (a) curved (b) stenosed 30% (c) stenosed 30% with noise,
(d) a zoomed-in version of (c). Discrepancies between the calculated and true volume is about 1-3%.
|
In addition to the CFD calculations, we have developed methods for determination of the
velocity field from high-frame-rate (30 fps) angiographic acquisitions as the contrast flows through the vessel. Here GPUs
are a critical component as our investigations involve generation and analysis of simulated angiograms for a variety of
situations (vessel geometries and initial conditions). Using standard CPUs, generation of single angiographic sequences
take several minutes, with the analysis to calculate the flow field taking tens of minutes. We have ported these calculations
to a GPU and evaluated the various situations. Our results indicate that the 3D contrast
distributions can be faithfully reconstructed (volume discrepancies < 3%) and that the 3D velocity fields have about a 10%
average absolute error. These angiographic results along with the angiographically determined vessel geometries will serve
as input to our library search (above), the interpolations and refinements, and our evaluations.
|
|
The image on the right illustrates the average velocity between surfaces at the central plane of a 30%
stenosis, widened to show details. (top) Actual average velocity, (middle) calculated average velocity
without noise and (bottom) with noise (SNR = 10). Discontinuities in the average flow fields occur at the
contrast surfaces. Data is missing on the right edge of the images because one of the bounding contrast surfaces
is outside of the image field of view. The percentage average absolute error is around 10%, with the errors arising
primarily near the edges of the 3D contrast surfaces.
|
| |
- Virtual Intervention System - RoboPlan
Introduction : Our RoboPlan virtual intervention system will provide a comprehensive virtual open
surgery platform with surgical training and assessment capabilities. This versatile tool will enable medical trainees
to get realistic hands-on experience in a range of patient specific surgical procedures before operating on real patients by
providing real-time haptic/tactile and visual feedback.
RoboPlan will provide capabilities for pre-operative planning, 3D visualization, and intelligent surgical guidance
based on pre-existing data and critical anatomical features. In addition, Roboplan’s assessment feature will provide
standardized feedback and evaluation scores allowing for competence based advancement of residents.
RoboPlan will provide an efficient, inexpensive, multi-use solution that will complement the current training
methods in Orthopedic Surgery and will overcome the limitations inherent in the traditional approaches and
currently available training systems.
|
Overview : RoboPlan comprises of three key elements:
Visualization, haptics, and robotics.
- Visualization: A patient specific large displacement finite element 3D model will be generated from MR and CT images to provide
realistic deformation and force-feedback during interaction with the surgical device. The 3D deformable model will be compressed
for network streaming to minimize latency. A robot controlled by the Mentor/Experienced surgeon will be used to do the surgical procedure.
High performance GPU-based algorithms will be used for the numerical computations of partial differential equations and realistic
visualization of heterogeneous deformable models at the required rate of 25Hz.
- Haptics: The force feedback computations for haptics and reconstruction of the 3D graphics interface at the remote location based
on the deformations will be done on a cluster of multi-core graphics processors to achieve realistic haptics response at the
required rate of ~1000Hz.
- Robotics: A two master single slave system will be built to allow a mentor surgeon interact with a trainee surgeon while
collaborating on a surgical task through a share-control of the surgical robot.
|
|
|
|
Development Plan :
RoboPlan system is being developed following a parallel, tiered, modular approach. Tier1 comprises of
offline modeling, development of graphical user interface for the designed framework, segmentation,
two-dimensional and three-dimensional interactive visualizations, virtual and physical model correlation,
and intra-operative surgical navigation. Tiers 2 and 3 mainly entail haptics, deformation modeling and
visualization, intelligent surgical guidance, and standardized assessment tools. Tier 4 involves
the integration of external components like Robotics within the RoboPlan application framework.
|
|
Current Implementation :
We have successfully completed the
implementation of Tier1 functionality. In addition, we have also developed an autonomous, web-based anatomy
learning and training tool based on the Magnetic Resonance Imaging (MRI) to enhance current training modalities.
The three main functional stages involved in the development pipeline of our intra-operative
surgical navigation system for RoboPlan are detailed below.
|
|
- Stage1 (Imaging Data Acquisition and Pre-processing): We utilize patient specific pre-operative
Computed Tomography (CT) and Magnetic Resonance (MR) imaging datasets to derive their corresponding
three-dimensional anatomical models. CT utilizes X-rays (ionizing radiation) and represents the measurements
of attenuation values ranging from 0 (water) to -1000 (air) in the reconstructed images in Hounsfield Units.
Although, CT could be efficiently used for extracting certain structures like bone, MR, which uses non ionizing
radio frequency waves and magnetic field, is preferable especially for soft tissue structures.
Several validation checks are imposed in the RoboPlan application to ensure integrity and compatibility of the loaded data.
- Stage2 (Three-dimensional model generation): We construct a highly detailed, patient specific
three-dimensional (3D) model from the validated imaging data (Stage1). Our model construction approach
comprises of three main steps. In Step1 (image-image registration), the imaging modalities are registered using a point based CT-MR registration
approach. Image-image registration is used to establish the spatial correspondence between the coordinates of two
or more image spaces. In Step2 (segmentation), a 3D image volume is derived from the available 2D imaging data and
then segmented with a high degree of accuracy. We deployed a hybrid segmentation approach to accomplish this task.
Subsequently, in Step3 a highly optimized and computationally efficient 3D model is derived using the segmented image
volume, from Step 2, based on our novel surface reconstruction scheme (publication under review).
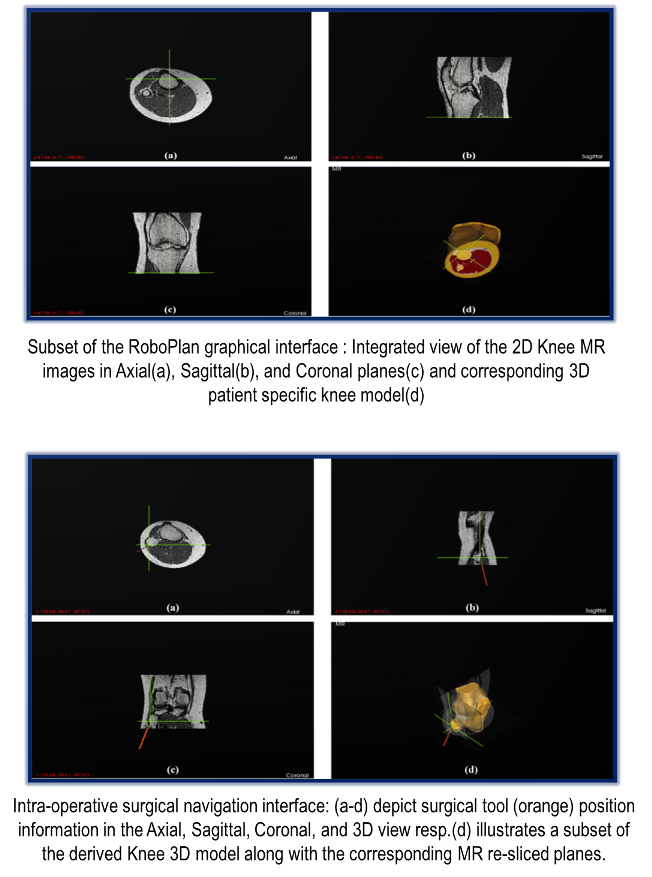
- Stage3 (Navigation and Visualization): Surgical navigation is a critical component of our virtual reality based
intervention system. It can not only provide vital information to the surgeons but can also help facilitate effective
decision making. We utilized an IR based optical tracking system (NDI) to incorporate the tracking functionality.
Our application enables visualization of the surgical tool positions in real-time in both 2D and 3D views.
|
|
Tier 1 : eLearning Tool
We have developed a comprehensive, autonomous, web-based anatomy learning and training tool to
augment the current training and learning approaches. Presently, the tool provides detailed,
cross-sectional, annotated MRI studies of the normal anatomy of knee. The tool is currently being enhanced
further with an aim to provide a centralized musculoskeletal anatomy learning platform to the medical community.
|
|
|
|

